|
|
Page 1 of 2
« Page
1
2
Page »
-
 | |
|
Hallo Cycle777888,
schön das sich auch mal jemand aus Deutschland hier meldet :-)
das klingt interresant was du da machst. Ich dachte immer es sei nicht möglich per Script eigene Daten in Tradingview zu importieren.
Ich schreibe dir....
Grüße! |
-
 | |
|
in some markets there are no bullish reversals in the reversals tab. However, in the dashboard tab , there are bullish reversals. Has somebody an idea why this is? Those reversals in the dashboard seem to be valid reversals since they appear in the elected reversals table when they are elected. |
-
 | |
|
it looks like everything went well with the migration. 
if you find any issue or have a suggestion, please post it in this thread.
The accounts and login should be the same as before.
Direct links from the old forum are broken, unfortunately.
old: showthread.php?tid=84
new: RE: April 29, 2019 Weekly ECM |
-
 | |
|
Hi all,
it looks like the "aggregate" row of the weekly and daily arrays has been fixed. Turning points are now easily identifiable and do not change often. |
-
 | |
|
I'm curious to know how many forum user have already subscribed to Socrates Basic, Plus or Pro membership and which trading style you prefer.
membership option poll is here and the question is on the top of the page
Trading Style ---------- Time Frame ----------- Holding Period
Position Trading ------- Long Term -------------- Months to Years
Swing Trading ---------- Short Term ------------- Days to Weeks
Day Trading ------------- Short Term ------------- Day Only – No Overnight Positions
Scalp Trading ----------- Very Short Term ----- Seconds to Minutes – No Overnight Positions |
-
 | |
|
Armstrong has published the buy and sell signals for the Dow on the below long term chart. He has mentioned the "net profit/loss" number, but that in itself is not telling much about the real profit that could have been made. I've Iooked at every single position and calculated this chart with some real position and equity numbers. The following was the outcome.
Positions are additive and for simplicity I've taken the initial Dow at 7000 points = 7000$ for 1 position, but this can of course be scaled up or down. Depending on how much drawdown you are willing to accept (or capital / leverage is used), the below table shows the profit that could have been made.
Since the initial position size of 7000$ will change over time, the average position size during those 18 year was 10.500$ per position . The maximum number of open positions at one point was 9 positions which equals around 120.000$ in total. This was between 2004 and 2008 and all 9 open buy positions were closed in 2008 when the first sell signal came up. Then the first sell position was opened when the bear market ongoing. In 2002 the amount of sell positions was 9 positions (from 9 sell signals) which results to about 76.000$ in total, In Oct. 2002 all 9 sell positions were closed and a buy position was opened at the same time.
There was one period during 2008 and 2009 where 8 positions were accumulated (= 55.000$) and and in 2013 til 2015 it were 5 positions ( = 70.000$)
The average equity used over the 18 years was 35.000$ in this example.
The maximum drawdown happened during 1999 and 2011 were 3 consecutive open positions were closed with loses during a choppy period.
These numbers are calculated on the long term. There were 3 bull markets and 2 bear markets during that 18 year period. To take advantage of these numbers, one should to stick to those signals for at least 2 years (better 3 or ideally 18 years), I would say. As Armstrong also said, these signals work well during bull or bear markets. If the markets move sideways for a long time (several years), then signals don't work so well without timing.
------------------------------------------------------------------------------------------------------
The below values are related to the average equity invested over the whole time period of 18 years. In this case it is 35.000$
9 simultaneously open positions max. = 120.000$ max. investment at some point.
Max. drawdown is related to the average equity.
Max. drawdown 9% profit 160% (56.000$ without leverage)
Max. drawdown 18% profit 320%
Max. drawdown 27% profit 480%
Max. drawdown 36% profit 640% (224.000$ - with a leverage of 4x per position)
Max. drawdown 45% profit 800%
Max. drawdown 55% profit 960% (336.000$ - with a leverage of 6x per position)
------------------------------------------------------------------------------------------------------
Since having 120.000$ invested at some point might not be an option for everyone, I've calculated this for fewer positions as well
and skipping everything above that position number. This is given that the initial positions size is 7000$ per position and position size is growing over time.
3 simultaneously open positions max = (40.000$ max.) - 10.500$ in average per position , average equity used during the 18 years = 23.000$
The 50.000 for 3 positions were only when the Dow was at
Max. drawdown 15% profit 160% (37.000$ without leverage))
Max. drawdown 30% profit 320% (74.000$ - with a leverage of 2x per position)
Max. drawdown 45% profit 480% (111.000$ - with a leverage of 3x per position)
Max. drawdown 60% profit 640% (148.000$ - with a leverage of 4x per position)
------------------------------------------------------------------------------------------------------
During 1997 til 2015 the Dow itself had a max. drawdown of 50% (in 2008) and a total profit of around 250%. However, who could have known that it really goes up to 17.000 - 18.000 in 2012 with all of the banking crisis and subprime crisis going on. Who would have bought and sold the Dow during the panic of 2001 or 2008 correctly?
So in my opinion those signals were very successful compared to the Dow itself and it is super-simple to follow. You just have to consider the buy and sell signals by looking once a month at Socrates.
What also needs to be considered is position size, leverage, duration of investment, trading tools (ETF's or alike), the max. number of positions and the max. drawdown that can be accepted. Profits could be re-invested and additional equity could be added over time so that one doesn't have to start with 120k or 35k equity from the beginning.
With only 3 open positions max. it may happen that one is not trading at all for 2 years because there were more than 3 positions open at the same time. Also a leverage of 2x - 3x would be good to compensate inflation.
This one took me several full days to collect the data and create the formulas. Quite some work...

*** Update 1 ***
some stats on 9 positions strategy : 49 trades in total - 36 win / 13 lost
some stats on 3 positions strategy : 49 trades in total - 30 traded (20 win / 10 lost) - 19 trades omited (more then 3 trade at the same time) |
-
 | |
|
there is a new version of the Socrates user manual available in Socrates knowledge center (under Help). It's the Jan. 2019 version . |
-
 | |
|
Recently I've noticed in SOC Pro that there are many daily reversals are shown as elected, but have actually never been published in the reversals page. In another forum I've read that this can happen, but I'm not sure why and why so often. In about 7 weeks, out of 15 daily elected reversals in one market, 8 were not published. On the weekly level 3 out of 5. They were only shown the day after they were elected. And then there are also some elected from levels that not even briefly have been touched. E.g. The price is now at 45 and traded between 43 and 45 in the last session and the reversals stands at 50. Then all of a sudden an elected reversal appears at 37 where the price not even remotely was in the last trading session(s).
I assume this is still the expected behavior, but it would still interested to know more about it. If someone finds an explanation for this it would be nice to post the link here. |
-
-
-
 | |
|
1. Somebody here who has some experience with Socrates Standard Level? Can you trade profitable with only SOC standard info?
2. I would be also interested on how you'd trade the indicators and numbers that are provided in the SOC standard. The statements there are at times confusing because several indicators seem to contradict itself at the same time level (like monthly). Something like this in Gold:
...This is warning to pay attention since last month had closed higher so the upward momentum is weak on the monthly level. ... Comment: why is the upward momentum weak if last month closed higher???]
Comment: But at the same time the monthly GWM momentum is bullish
.....For now on a broader perspective, this market in an uptrend posture looking at the monthly level.....
Some caution is necessary since the last high 137750 was important given we did obtain three sell signals from that event established during July 2016
....We have generated a buy signal so some caution is required..... |
-
 | |
|
Mainstream Media is Dying — Facebook Recognizes Trend
Zitat
Facebook explained the move is not about privileging certain sources over others, but about better “connecting people and ideas.” This move will allow online sources to be given favored status above the mainstream media, which confirms the trend is changing.
I can't fully agree with this statement MA made today.
Here in Germany mainstream media is now heavily involved with promoting news articles over Facebook. Facebook has its own algorithms for newsfeeds which it does not disclose. I seriously doubt that the avarage facebook user will be presented controversial news that friends are reading. Facebook itself has become mass media / mainstream media. I have no doubt that Facebook does , at least partially , control what will be big news and what won't. That is totally in-transparent and Facebook will have even more power over media than traditional mass-media had up until now because it's Facebook who is deciding who will get which news.
|
-
-
 | |
|
Hi there,
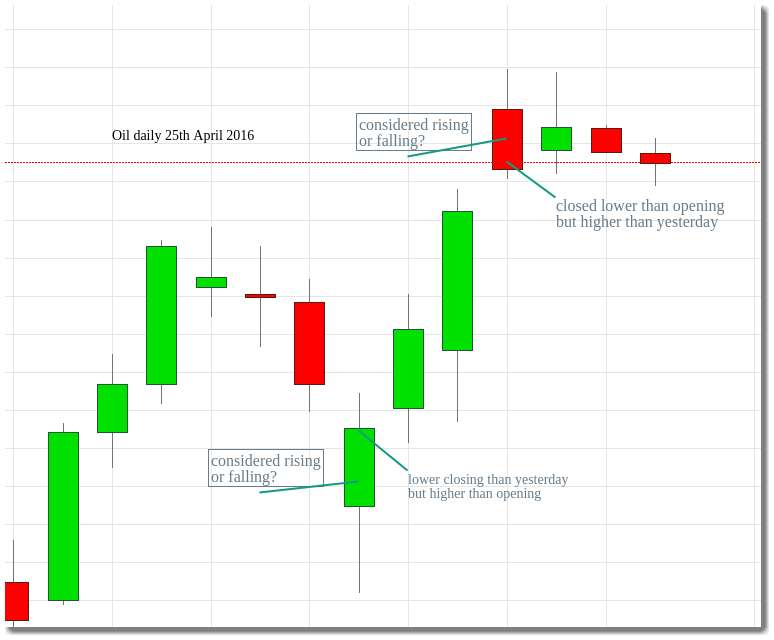
I'm looking at a daily array in Oil and I'm thinking what is considered to be a day with a rising price vs. falling price. Here is a constellation where in case 1 oil is rising intraday but falling on a closing basis. Case 2 is the opposite. It's falling intraday but rising from one day to the next day.
So my question is, what is MA consider to be a rising price (or falling price)? intraday or on a closing basis? In this case it's the daily level, but this can also happen weekly, monthly or yearly.
Thanks.
Alex
 |
-
 | |
|
on Monday the AUD elected a daily bullish reversal at 7628. It rallied only 0.3% from the close of Thuesday, up until now. This is really not much and I'm curious to see if there will be a new high today or tomorrow. According to Martin's reversals rules there is still a chance that a new high will be made this week (up to 3 time units after the election of a reversal).
I'm not that optimistic though that a new high will be made since the USD-Index went up quite a bit and also from other reversals I know that the first time-unit of a reversal is the most important.
With daily reversals I don't have that much experience, so maybe it's different here.
One more comment: after a reversal is elected, sometimes the reversal is retested (1% rule - see MA video). Although the close was 0.7% above the reversal, maybe yesterdays decline is still only a retest of the reversal. We shall see... |
-
-
 | |
|
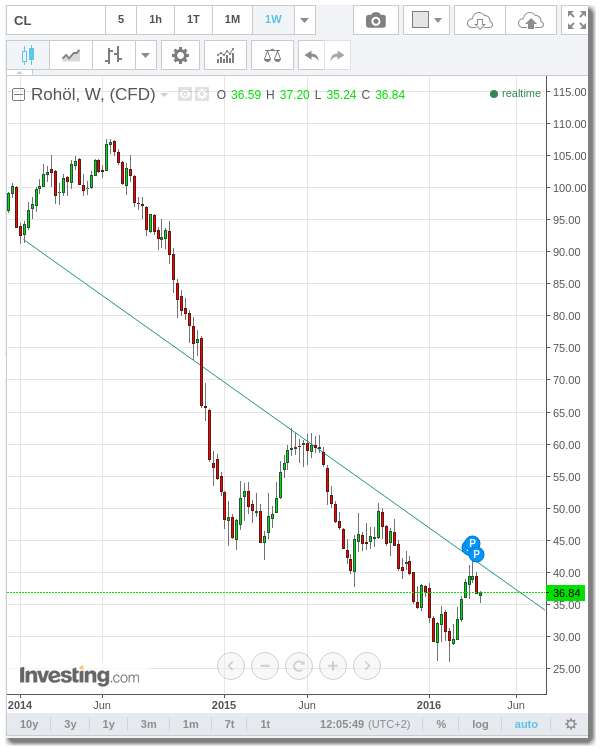
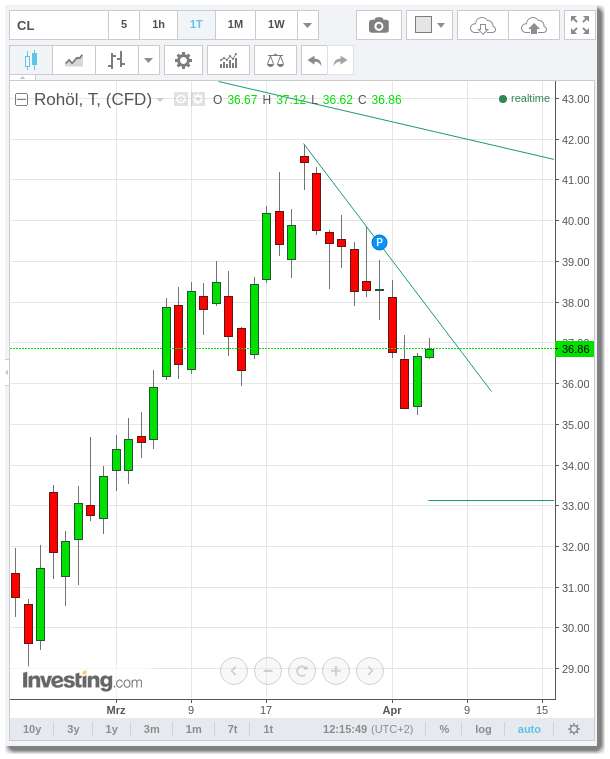
Oil has the potential to rally into May since it didn't close below 35.xx in March. This is according to Martins Blog. What do you think, is the rise in price from yesterday and today only a reaction?
I would say that if Oil closes today and tomorrow higher, there could be a good chance that the low has been made yesterday. If it turns back down, then I guess the next target area is the monthly bearish at 33.30.
Martin talks below about weekly bearish reversals in Oil, but I've not seen any such numbers published. Have you seen any?
Thanks.
17.3 on his Blog:
Zitat
if we at least close March above the February high of 34.69, then we have a shot of more than a one-month knee-jerk reaction high. Then we can look for a possible 3 month rally into May. The two primary target at the $45 and $49 level. That has to be exceeded to hope for an rally to reach the formidable resistance zone in the $69-$70 area.
Zitat
April has been a panic cycle in many markets as well.
24.3
Zitat
The next key area to watch will be the 3400 level.
Overall, we are looking to May to provide the next turning point. So pay attention. If we start to elect bearish reversals on the weekly level, we may indeed see a decline unfold.
This is how Martin has drawn the down trend line: -----------------------------------------------------------------------------my daily trend line
 
|
-
 | |
|
I noticed that arrays can change over time. The one on the right hand side is an updated array that Martin has posted recently and left one is 5 weeks old.
I know that the composite bars are proportionally and can change over time because the bars in one row stand in relation to each other. But in the above case it doesn't have to do with proportional changes, in my view.
Martin also stated that the lowest bar can be a turning point. If I look it that way, then the 03/28 is still a turning point.
The bar on the 25th went up a lot for some reason I don't understand. But it seemed before a significant bar and now has become even more significant (or a definitive turning point)
Volatility on 03/28 is now gone where previously there was something.
In this case direction changes and the panic is still unchanged, but I noticed cases where that did change also.
[removed array - please see the gold report forum] |
-
 | |
|
Martin wrote in the market update 1th April:
Zitat
Indeed, if silver break the 1470 level, we are looking for a serious thrust downward. Once we start to elect Weekly Bearish Reversals, the bull trap is confirmed.
Is this a daily bearish reversal?
Maybe corresponding to the daily bearish in Gold given recently on the Socrates Blog?
The next bearish weekly reversals I have are from the Gold Report update Sept 2015. Are they still valid?
I've not seen any new weekly bearish in Silver since then (also not in part 1 of the new Gold report).
Thanks
|
-
 | |
|
recently Martin mentioned on his blog that Gold may close either sideways directed or neutral.
What is the difference?
Does sideways mean definitely sideways and neutral means that there is still up-and downside potential? I thought that both is the same.
Thanks |
Page 1 of 2
« Page
1
2
Page »
|
