

 Print view
 Fri Apr 01, 2016 10:37 pm
|
|
Armstrong wrote the following on April 1, 2016 |


 reply
reply

|
|
Zitat von DigiLab
|


|
|
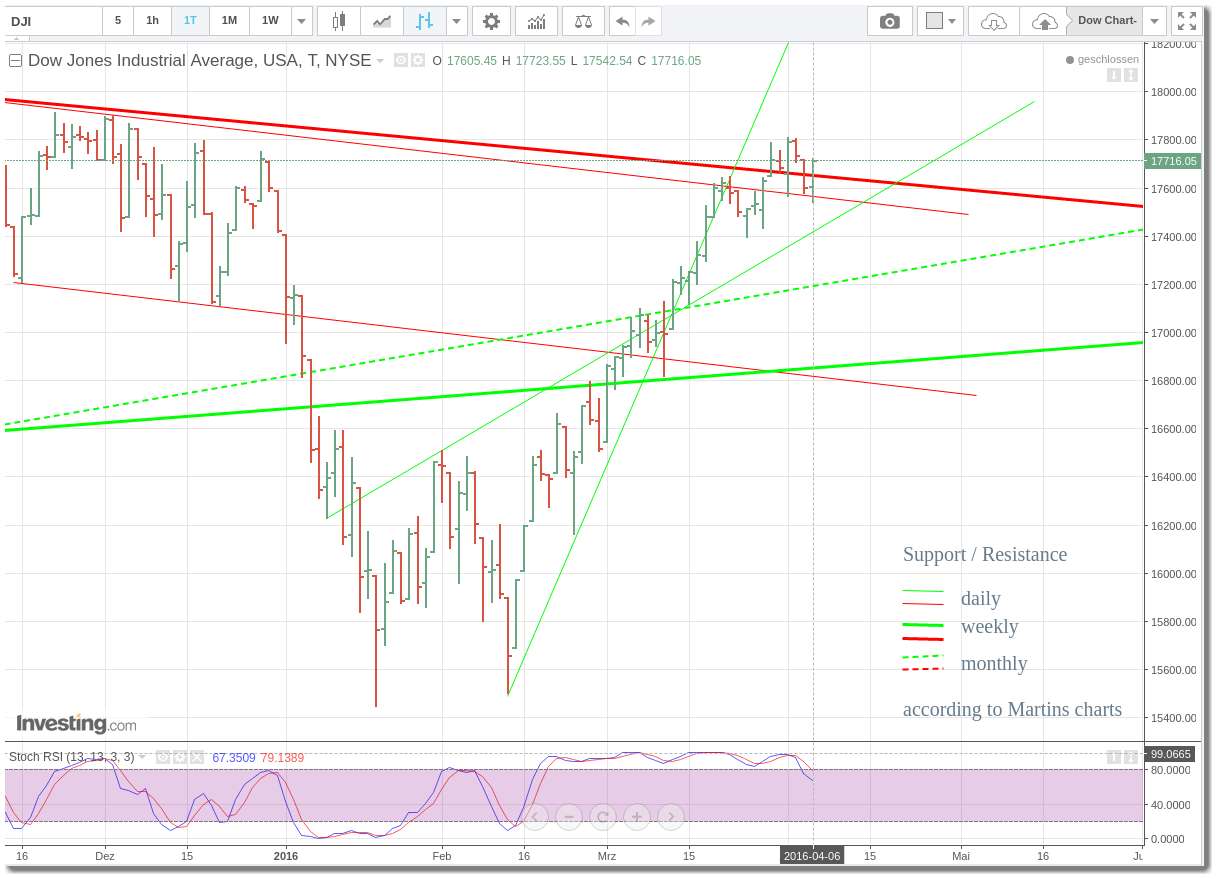
today the DOW came 0.29% to the daily bearish 17434. I guess this can be counted as a retest, right? |
|
|
Zitat von Alex
|
|
|
Zitat von PSP
Zitat
|
