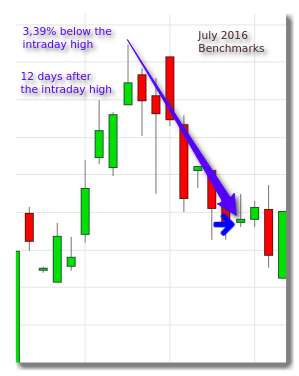
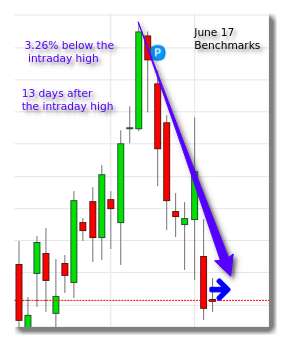
thanks for the heads up on the benchmarks. Here are my thoughts on the major benchmarks. I'm not sure how to interpret the current one from June. in 2011 the important benchmarks produced a high and in 2015/2016 a low. So for Q3 of 2018 we could either see a new low (below 1000 USD) or a new high above 2000 USD. This is only considering the major benchmarks. So there are 15 month to go for that date. In 2010 Gold went, within 15 month, 750$ up and in 2012 600$ down (in 8 month). If we get a sling-shot type of scenario (say 300$ down , then up) , Gold would have to make 300$ down and then 1100$ up. That would be 1400$ within 15 month. That sounds a lot to me, but as MA stated, if the slingshot comes, then it could be pretty violent. A direct high (without slingshot) in 2018 would be along those lines of the 2010 / 2012 major moves.
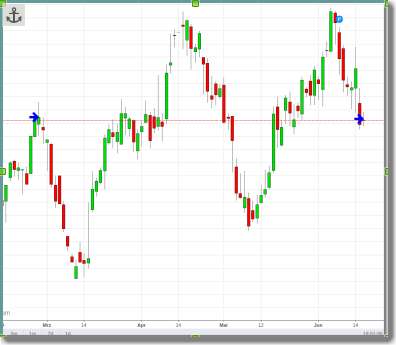
Here is a messy chart that shows how the benchmarks can act as continuation moves or signal tops and bottoms. I think the June 19 bench mark will mark a continuation lower. http://imgur.com/a/eCbUl
*** having some issues posting a pic - sorry - see the above link
Hello Entran, a June high would align well with the benchmarks on Monday which I would also interpret as a high. It's not a perfect high, but nevertheless it could be like the 2016-07-18 benchmark high where the benchmark day came 13 day after the intraday high, 3.39% below the high. This time its 12 days and 3.26% . UPDATE 17th June -updated this post with percentage numbers, screenshots and corrected the June Benchmark day
One other interesting coincidence (or probably not). The last benchmark and this one are the same price (just 1 $ difference). 27 Feb 1257 16 Jun 1256
@ PSP I'm using Hotshots (Free and Open Source) for as my screenshot tool. When uploading the pic to the internet, they allow the screenshots to be on forums and the Image-URL is quickly prepared to be able post it real quick.